In this post, I will discuss how we can download a printable HTML file with canvas apps charts.
I will continue to use the sample solution. You can easily download this, import it to your PowerApps environment and follow the steps as we go.
To summarize the requirement, we have a pie chart in the canvas app and we need to export this chart to a printable document.
Canvas app doesn’t support exporting PDF or any type of printable document. Therefore, this process requires a few steps.
- Pass the chart field values to PowerAutomate flow as a button action
Let’s look at our app. Since we already created ChartCollection with all necessary fields, we can convert this collection to a JSON object and pass it to PowerAutomate.
In one of my previous posts I have explained passing values to flow from canvas app.
a. Add a button “Generate Charts”.
b. Update OnSelect code with below:
Set (ChartObj, JSON(ChartCollection));

c. Now, click Actions > PowerAutomate and create a new flow

d. Create a flow according to below sample. You can select any value for name, location etc. we just need to create the connections at this point. Once done, save the flow.

e. Now, go back to your canvas app. It should show the new flow. Click on the flow and it will add the flow to the button.
f. Update the button OnSelect code with below:
Set ();
ChartObj,
JSON(ChartCollection)
);
Set (flowresult, ChartGenerationFlow.Run(ChartObj)
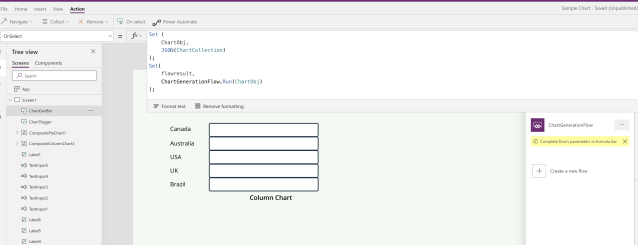
g. We are creating a ChartObj JSON object and passing it to the flow. The values coming from the flow run will be assigned to flowresult object. Now, save this and run the app onetime.
h. Now open the app again and go to Button > Actions > PowerAutomate. Select the flow and click edit.

First part is done now. We need to edit the flow.
2. Flow configuration- Parse values and create printable HTML document in SharePoint
a. First, we need to parse the JSON object.
b. Go to the last run flow record and expand the “Parse JSON” action. You can see the object passed through from the canvas app. Copy the body and click edit flow.

c. Now click on the “Parse JSON” action > Schema > Add sample JSON Payload > Paste the body

If the schema is correct, values should appear as variables.
d. Lets create the HTML code now. You can refer to Shane Young’s video tutorial to get a comprehensive understanding on how to create HTML using flow expressions
e. We need to get the variable names for each of the fields. For this, add a variable to HTML content field. Flow will put the create file action inside a for each loop. This is fine. Now hover over the variable. You can see the identifier. Save it down somewhere.

In this case, all my variables are here:
- items(‘Apply_to_each’)[‘Australia’]
- items(‘Apply_to_each’)[‘Brazil’]
- items(‘Apply_to_each’)[‘Canada’]
- items(‘Apply_to_each’)[‘UK’]
- items(‘Apply_to_each’)[‘USA’]
f. Now, we need to create the HTML document. To generate charts, we need javascript code. I am using CanvasJS library. You can use any library as per your preference.
Concatenate HTML – Refer to Shane Young’s video. Furthermore, I am adding my flow variables to the Javascript chart as Y values.
concat('<!DOCTYPE HTML>
<html>
<head>
<script>
window.onload = function() {
var chart = new CanvasJS.Chart("chartContainer", {
	animationEnabled: true,
	title: {
		text: "Sample Report with PieChart"
	},
	data: [{
		type: "pie",
		startAngle: 240,
		yValueFormatString: "##0.00\"%\"",
		indexLabel: "{label} {y}",
		dataPoints: [
{y:', items('Apply_to_each')['Australia'], ', label: "Australia"},
{y:', items('Apply_to_each')['Brazil'], ', label: "Brazil"},
{y:', items('Apply_to_each')['Canada'], ', label: "Canada"},
{y:', items('Apply_to_each')['UK'], ', label: "UK"},
{y:', items('Apply_to_each')['USA'], ', label: "USA"}
]
	}]
});
chart.render();
}
</script>
</head>
<body>
<div id="chartContainer" style="height: 370px; width: 100%;"></div>
https://canvasjs.com/assets/script/canvasjs.min.js
</body>
</html>')
Now we have everything we need to create the HTML. Let’s go back to editing the flow.
Go to “Create file” SharePoint action and add below expressions. First, we should add a suffix to any created file so that the file name is unique. This will make sure that for each submission, flow will create a new HTML in SharePoint.

Then let’s copy the HTML body from previously created concat expression.

Now, save the flow, go to the canvas app and run chart generation.
Let’s test this now!
So far, we were able to pass canvas field values to flow and generate a HTML document in Sharepoint with charts.
In the next post, let’s discuss how we can create a PowerApps action to download the HTML document from within the canvas app, without going into SharePoint.
Happy Learning!
Categories: Power Automate, PowerApps, SharePoint

Leave a comment